

Indian households are quietly rewriting their monthly budgets. Food, which once dominated the family shopping list, now accounts for just under a third of total household spending, while non-food goods and services take up nearly two-thirds. That is the headline finding of a new State Bank of India research report released on Friday, October 30, and it says a lot about how India lives, shops and spends in 2026.
The report, from SBI’s Economic Research Department, is built on the National Statistics Office’s Household Consumption Expenditure Survey for 2023-24. It covers 261,953 households across rural and urban India, surveyed between August 2023 and July 2024. The picture is not of families cutting back on food, but of incomes stretching further, into services and durables once out of reach.
Food at 32.82 percent, everything else at 67 percent
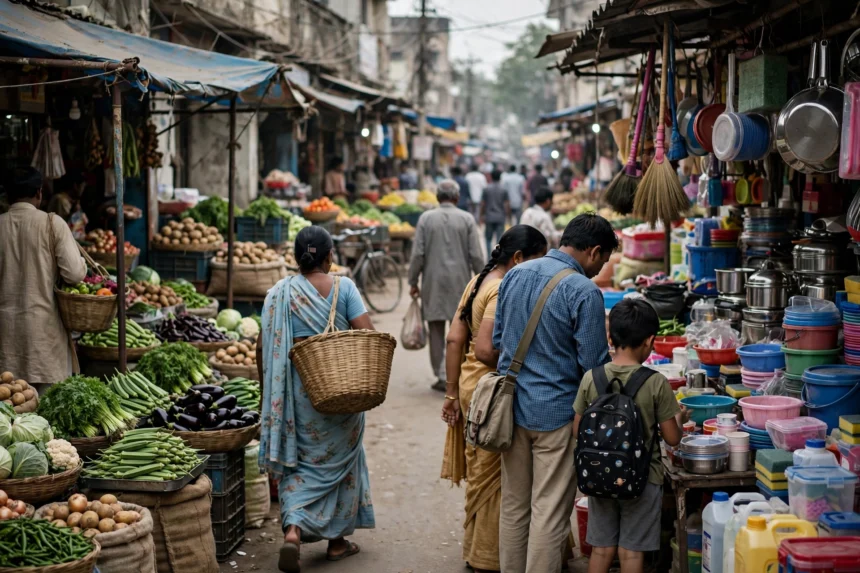
According to the report, food expenditure makes up about 32.82 percent of total household consumption spending. Non-food goods and services together account for around 67 percent. In plain terms, for every 100 rupees a household spends, roughly 33 rupees go on food and 67 rupees go on everything else: clothes, transport, fuel and light, education, health, entertainment and services.
That split is a rough gauge of living standards: when incomes are low, most of the budget goes on eating, and as incomes rise, the food share falls because families can afford more of everything else. The SBI report suggests that shift is now firmly under way.
Protein on the plate, but not equally everywhere
Households across income levels are increasingly prioritising protein-rich foods, the report notes, and spending on items such as eggs, fish, meat, vegetables, fruits and dry fruits shows relatively little variation across income groups. The desire for a more nutritious plate is shared widely, even if budgets differ.
But geography still shapes the plate. Sikkim and Goa recorded the highest average expenditure on selected protein-rich foods, followed by Haryana, while Odisha, Chhattisgarh and West Bengal reported the lowest levels. The report links the gap to differences in purchasing power, food prices and local dietary habits.
The digital half of India, and the offline half
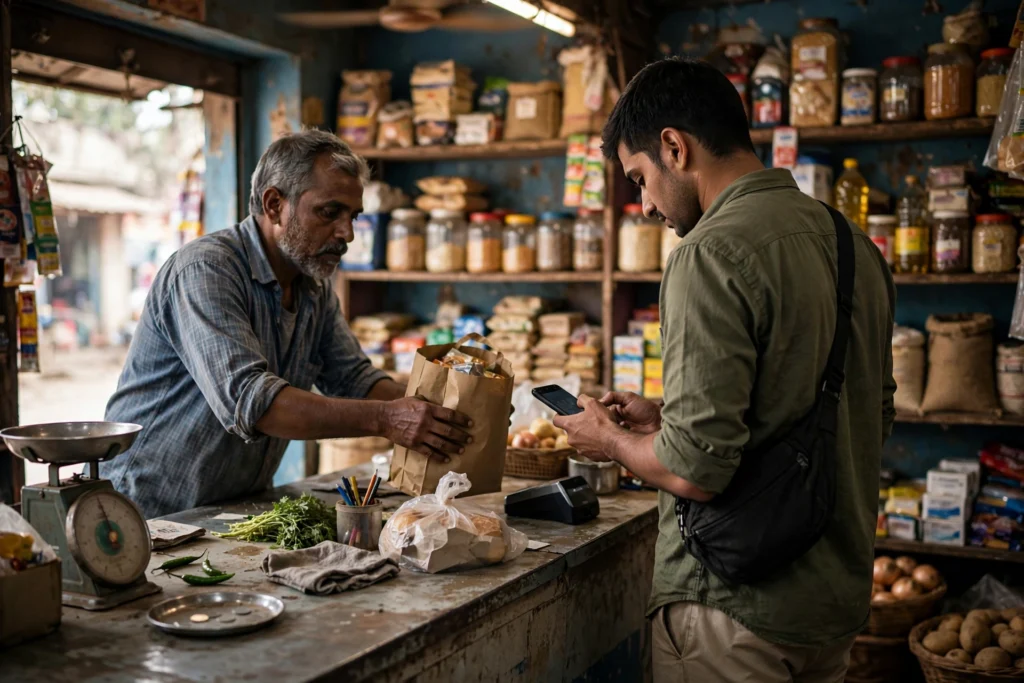
The same SBI report carries a second big story: how India pays. Around 45.6 percent of households now use online shopping or digital payment channels for at least one type of consumption purchase. The other 54.4 percent still rely entirely on traditional payment methods, which shows how uneven the digital shift remains.
Where people do shop online, the pattern is clear. Consumables and services lead digital purchases with a 39.68 percent share, followed by durable goods at 23.3 percent, while food purchases account for just 7.10 percent. Within food, routine groceries have the highest digital share at 4.29 percent. Fresh items stay stubbornly offline: vegetables at 1.32 percent, fresh fruits at 1 percent, and eggs, fish and meat at just 0.59 percent.
Clothing leads durable goods online at 19.97 percent, followed by footwear at 12.05 percent.
Income draws a sharp line through all of this. Digital adoption rises steadily with monthly per capita consumption expenditure, from 25.3 percent among the bottom 20 percent of households to 69.5 percent among the top group. Households that use digital channels also tend to spend more overall, with 7.5 percent higher monthly per capita expenditure than those that do not.
What this means for everyday India
Haryana ranks first among states in average monthly consumption expenditure across food, consumables and services, and durable goods.
For families, the numbers translate into familiar scenes: a grocery run that is now only part of the month’s spending, a phone recharge, a school fee, a shirt ordered online. For businesses, growth is increasingly coming from services and digital channels, not just staples. For policymakers, food security still matters, but the fastest-moving parts of household life are now services, health, education and connectivity.
The report does not claim every household has arrived at the same place. The gaps between states and between digital adopters and the offline majority remain wide. What it shows is direction: households are spending more on life beyond the kitchen, and doing it with a phone in hand more often than ever.
FAQs
What did the SBI report find about household spending?
Food accounts for about 32.82 percent of total household consumption expenditure, while non-food goods and services account for around 67 percent, according to the SBI report released on October 30, 2026.
How many households were covered by the survey?
The findings are based on the National Statistics Office’s Household Consumption Expenditure Survey 2023-24, which covered 261,953 households across rural and urban India between August 2023 and July 2024.
Which states spend most on protein-rich foods?
Sikkim and Goa recorded the highest average expenditure on selected protein-rich foods, followed by Haryana, while Odisha, Chhattisgarh and West Bengal reported the lowest levels.
How many households use digital payments for shopping?
About 45.6 percent of households use online shopping or digital payment channels for at least one consumption purchase, while 54.4 percent still rely on traditional payment methods.
Which state tops average monthly consumption spending?
Haryana ranks first in average monthly consumption expenditure across food, consumables and services, and durable goods, the report found.
India’s spending basket is changing. The kitchen still matters, but it no longer defines the household budget. What families buy and how they pay are moving beyond food, and that shift will shape markets and everyday life for years.